

 PRICE TAG IN CUSTOMER RATES?
Bruce Williamson and Branko Terzic
Fortnightly Magazine – April 2024
The rapid expansion of the U.S. transmission grid is the centerpiece of efforts to reach full electrification of the U.S. economy and net-zero decarbonization goals by 2050. Over the last two decades, the attention of the public was first drawn to the importance of renewable generation, and now there are seventeen hundred gigawatts of renewable generation in queue, thirty percent more than traditional generation plant.
More recently, our attention is being directed to the urgency of getting green electrons from utility scale solar and wind farms to distant markets in time to meet national and state decarbonization targets. The solution for moving wind and solar electrons to market is to build extraordinary amounts of transmission, storage, and distribution circuits in twenty-six years or less.
With limits on local patience and the improbability of siting enough large intermittent generation sources close to the more densely populated areas of the U.S., many terawatt hours of green electrons need to flow reliably over regional operator boundaries and constraints. That is hundreds or thousands of miles to electric ratepayers and customers who wait for those electrons to light, heat, and cool their buildings and residences, energize transportation, and power their industries.
We can add to that the need to integrate localized distributed generation, flexible demand, and virtual power plants, but here, the focus is on the high-voltage transmission infrastructure of one hundred thirty-two kilovolts and above, from an unfortunately overlooked perspective, that of the customers and ratepayers who will pay the bill.
We’ve observed that the formal studies of the grid transformation and the transmission expansion in particular leave many stakeholders unable to appreciate the context, scale, and costs of the effort needed, even if we may all agree on the decarbonization why.
For all the attention paid to complex models producing the national grid transformation scenarios and reports, almost nothing is said about the impact on ratepayers except for the inference that future savings should make it worthwhile and that it is affordable. For example, see the Princeton 2020 report, “Net Zero-America: Potential Pathways, Infrastructure, and Impact,” hereafter referred to as PNZ.In fact, comparisons of the national studies to identify ratepayer consequences is nearly impossible, which all but ensures the public generally and ratepayers in particular are excluded from the conversation.
We will refer to the PNZ study in what follows, as the PNZ findings have found their way into official department of energy press announcements. The PNZ study reports the transition away from fossil fuels will require that “[H]igh voltage transmission capacity expands sixty percent by 2030 and triples through 2050 to connect wind and solar facilities to demand; total capital invested in transmission is $360 billion through 2030 and $2.4 trillion by 2050.”
The distinction made by the PNZ study between transmission capacity expansion and total capital invested must be significant given the scale and urgency, but there’s more. In the write up accompanying the release of the PNZ study, there is also reference to expansion of transmission systems, as follows: “According to the research, the United States will need to expand its electricity transmission systems by sixty percent by 2030 and may need to triple it by 2050.”

The projected and quite urgent expansion of transmission investment, capacity, or system is attention-getting but vague. Unless we believe it can all be magically conjured into existence, we should be asking ourselves precisely what is needed, what it will cost, and who will pay for it.As economists and engineers, we are most concerned that all the capital required and the annual expense to maintain and operate the new transmission system transition will land squarely in annual revenue requirements for cost recovery from customers as ratepayers. We find no analysis in any of these studies that shows the projected investment is, in fact, affordable. Customer affordability of the projected requirements is never addressed.
There is an implicit expectation that all will get financed and paid for, all risks will be de-risked, future electricity savings will be abundant, all intergenerational concerns between costs now and future gains will be fully and convincingly resolved, and the GDP will scarcely be disturbed. In short, all customers and every aspect of the national economy are winners: there are no losers in grid transformation.
The national studies are clear on what the finish line will be: electrification by 2030 and net-zero carbon emissions by 2050. But what does this mean for the transmission plant in service for the ITCs and IOUs that will own and operate these circuits? What could it mean for customers who pay for it?

To answer that, and bring ratepayers into the conversation about grid transformation, we take a simpler approach to project the cost of transmission plant in service and expense from historical data relationships.
To answer that, and bring ratepayers into the conversation about grid transformation, we take a simpler approach to project the cost of transmission plant in service and expense from historical data relationships.
Assumptions and Method
One of the problems for proper analysis by ratepayers is that the details behind the several complex models are not available to stakeholders, including regulators, legislators, and most of all, the wider public. In our analysis we use Federal Energy Regulatory Commission Form 1 annual reporting data from 1972 to 2016, analyzed at the national level, to establish a historical baseline for Transmission Plant in Service, annual transmission Operations and Maintenance expenses, and the relationship with transmission structure miles.
Importantly, Form 1 filings by electric utilities with FERC conform to the Uniform System of Accounts, which has the same implication of used and useful for plant in service that would be used in rate proceedings by state regulatory commissions. At the State level, cost recovery through utility tariffs allocates these transmission expansion costs to ratepayers.
To make the data analysis more specific, we processed Form 1 data in all years to retain only Investor Owned Utilities and Independent Transmission Companies (Transcos). This usually comprises over two hundred reporting utilities and Transcos a year.
There is little loss of generality in the analysis due to the exclusion of publicly owned utilities, municipals, and rural cooperatives, who own minimum high-voltage transmission, with few exceptions. The same goes for the few merchant or independent generation companies (Gencos) in the Form 1 data, which may have some transmission related to interconnection, but by design are companies engaged as merchant generators to produce power.
In the larger picture, one that considers all IOU plant in service (production, transmission, and distribution) needed to hit the 2030 and 2050 targets, transmission plant is the smallest portion. In real terms, transmission plant over the last seventy years has been only fifteen to twenty percent of total utility plant in service; production plant (generation) averages forty-five percent (fifty-five percent before restructuring); and distribution plant has ranged between thirty percent to forty percent of total plant in service.
In this analysis we are not considering distribution plant in service, although when grid modification is extended to distribution plant, it may easily have twice the cost impact on electric utility rates as the expansion of transmission plant now underway. Ultimately, all utility plant in service will be earning a return on rate base for 2030 and beyond and will raise electricity rates for ratepayers.
We will use transmission structure miles as a summary metric provided by Form 1 because a forty-five-year data series exists. The statistical correlation between transmission structure miles and both transmission plant in service and transmission O&M expense provides a basis by proxy for evaluating the PNZ study’s 2030 and 2050 projections of needed transmission system capacity referred to earlier.
The choice of structure miles as a proxy deserves comment. Other proxies were considered but not used, such as transmission level substations and circuit miles. The Form 1 national summaries on transmission level substations and circuit miles are unfortunately limited, produced for only a few years several decades ago.
It is sometimes possible to increase the number of circuits carried on an existing tower, which increases transmission system capacity per se without the need for additional poles and towers, but we leave this refinement and the data required to a later effort.
The structure-mile-based proxy lends itself toward a serious conversation about rights of way, siting, and viewshed impacts. We made the decision to employ the Form 1 structure mile data as the proxy for capacity, and later found that the Energy Institute at the University of Texas had done the same for their research on grid costs.
With the correlation established between structure miles, transmission plant in service, and annual transmission O&M expense for the 1972-2016 historical series, we use trend to extrapolate structure miles, transmission plant in service, and O&M expense to 2020.
This is done to have the same starting year used in the PNZ report for their projections of transmission capacity expansion. We control for economic inflation as a factor by converting all dollar-valued data from nominal dollars used in Form 1 to 2012 constant dollars (2012$) with the GDP non-defense price deflator. The constant dollar series may later be referred to as a real dollar series.
Baseline Data
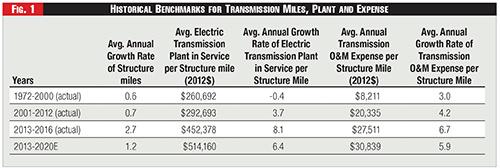
Figure One provides historical baseline values as context for the analysis. The historical growth rates of structure miles, transmission plant in service, and annual transmission O&M expense are presented. For forty years, from 1972-2012, transmission structure miles grew at an average growth rate between 0.6 percent and 0.7 percent a year.
Each structure mile nationally was associated with between two hundred sixty-one thousand and two hundred ninety-three thousand of transmission plant in real dollars. Annual transmission O&M expense per structure mile also increased steadily.
Beginning in 2013, the rate of change increased significantly in both plant and the expense required per structure mile. A variety of factors may be increasing costs, including reliability and resilience measures, natural disasters, interconnection and upgrade requirements created by integration of renewable generation, delays due to contested siting and permitting, and labor and materials constraints.
The bottom line is that there is a recent trend of rapidly increasing costs for transmission plant and structure miles. Many more utility dollars are now required per structure mile than ever before and will impact rate base and ratepayers. The general trend in utility costs will continue, not least because of reliability and resilience requirements, but also the pace and extent of grid modifications and expansions sought by policies at the Federal and State levels. See Figure One.
#BrankoTerzic #energy #regulations #experience #research #future #opportunity #strategy #management #people #electricity #power #utilities #future #renewables #RenewableEnergy #energysector #oilandgas #powergeneration #energyindustry #oilandgasindustry #sustainability